We’ve been very busy over the last few months at Fifty Five and Five, putting together the latest edition of the Microsoft Partner Top 50 Digital Marketing Report. Now in its fifth year, the report showcases the best of digital marketing from Microsoft Partners of all sizes and is set for release at Microsoft Inspire 2019, in Las Vegas, Nevada.
We have:
- Compiled a (very) long list of partners from across the IT industry
- Crunched the numbers
- Narrowed down the longlist to a shortlist and finally a complete list of the best marketing efforts from partners according to our scoring
How we score partners
Ranking is conducted via our Partner Benchmarking Tool. The tool ranks over 40 metrics spread across three categories:
- Blogging – frequency, clarity, quality etc.
- Website – speed, structure, SEO etc.
- Social – reach, output, engagement etc.
The score from these individual metrics combine to make an overall score, which is used to rank Microsoft Partners.
Every year we learn a lot about the state of digital marketing across the Microsoft Partner Network and the IT industry in general. This year was no different. Here are some of the findings from our report data that may help you focus more on your marketing strategies and improve the return on investment of your marketing.
Overall findings
The biggest difference between partners who made the Top 50 and the average Microsoft Partner was between their blog score and social media score. There was, comparatively, a very small distinction in website scores between those who made our list and the average partner. This could suggest that the quality of websites is improving across the Microsoft Partner Network while the quality of blog pages and social channel performance is much more varied.

Table 1: The average website, blog and social score for the Top 50 and the average Microsoft partner
Know your range and stay social
The figure below shows the Top 50 score range demonstrating the difference between the minimum value and the maximum value for website, blog and social media. Some companies may have scored well across all measures, while others may have scored high in one area such as their website but low in other sections such as social. Social media had the most varied results which shows that, for some companies in the Top 50, their social performance may be the area that’s bringing their overall score down.

Figure 1: The difference between the maximum and minimum value for Top 50 scorers for the website, blog and social
Website
Although there was little difference between website scores across the Top 50 and the average, there was still some notable disparities. The total number of outbound and inbound links for the Top 50 and the average was 401 and 208 respectively, a 92.55% difference. Although there is no specific number of outbound and inbound links that is the perfect amount for your website to succeed however the more links, and especially inbound links, means more traffic and better search rankings.
In addition, Top 50 partners’ desktop speed was 14.87% faster than the average partner and mobile speed was 13.22% faster. Some of the best ways to improve website speed is to enable file compression, minify CSS, Javascript and HTML and reduce redirects.
Blog
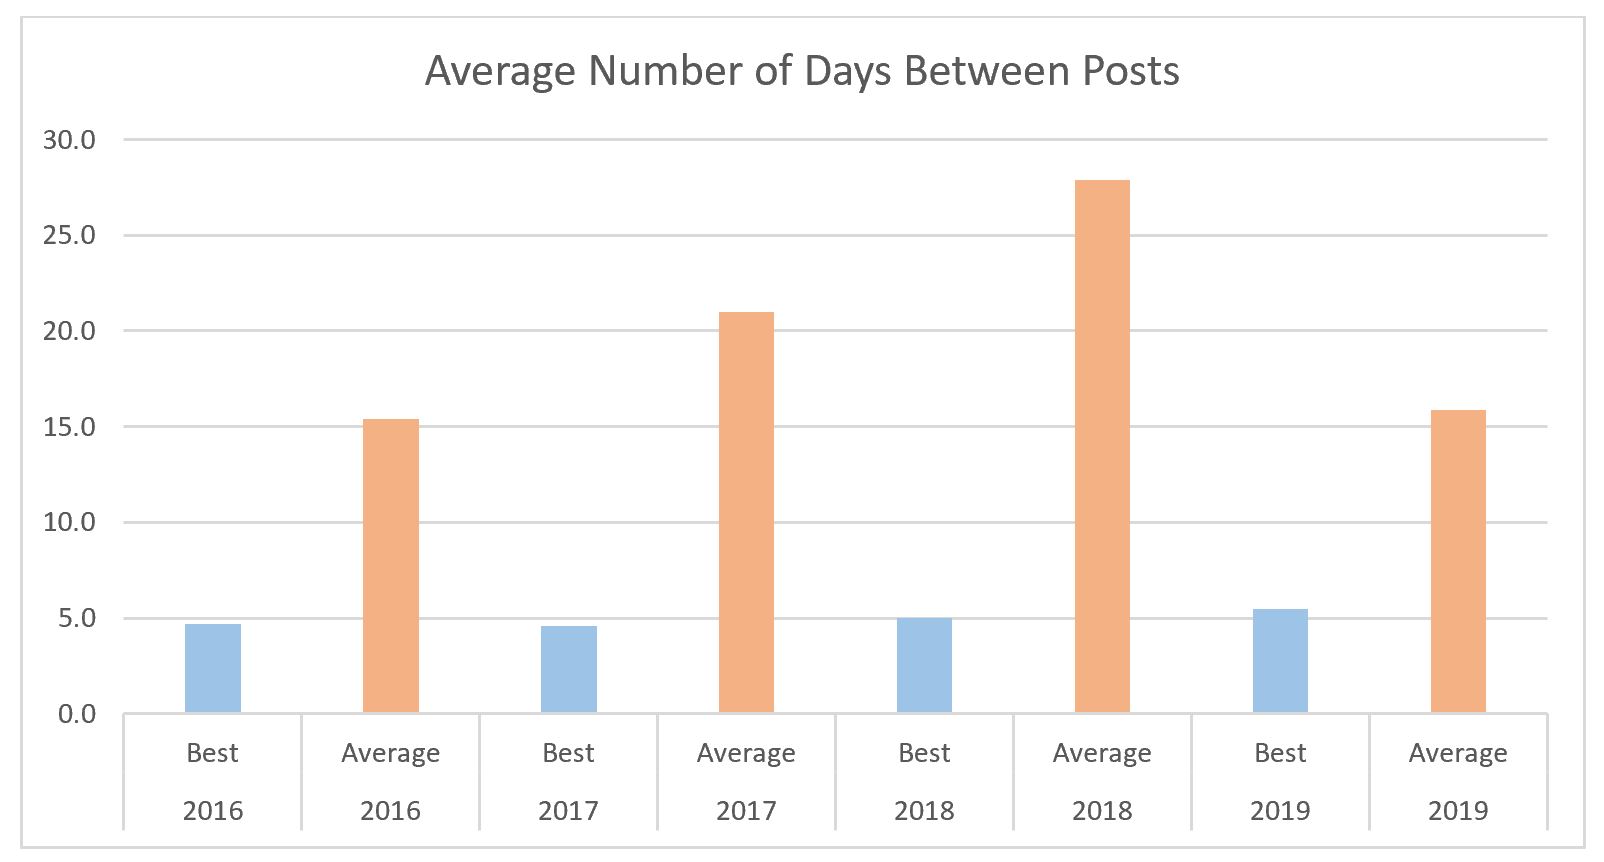
There are many important factors when it comes to assessing blog performance such as days between posts, readability, length, images, ALT tags, outbound links, sentences, title length, URL length and more. One of the most important factors is the frequency of posts. The Top 50 across the years have been posting on average every 4-5 days while the average partner is more sporadic and posts on average every 15-28 days.
Writing high quality content consistently is the key to not only good blog performance but also increasing website traffic. And, as you might expect, it can have a positive knock-on effect on social channels too. For example, our own website over the last four years has received, on average, 23% of total pageviews from blogs. That’s slightly more than one in five website pageviews via a blog post.
Another critical factor in content performance is the overall blog length. The average length in 2019 for partners in the Top 50 was 840 – this is 9.32% higher than the average partner. In general, the top scorers have an average blog length of between 800-1,000 words while the average is between 500-700 words.
Outbound links also play an important role in blog performance. It can help improve reputation, increase page ranking and encourage backlinks. The average number of outbound links per blog for the Top 50 were 4.35, 59.63% higher than the average.

Figure 2: A yearly comparison of the Top 50 (best) and the average Microsoft partner
Social media platforms
There is one important factor when it comes to measuring performance on any social media platform: engagement. This may be influenced of course by how many followers you have. Our Top 50 had on average 14,743 Twitter followers, 29,929 Facebook page likes and 41,572 LinkedIn followers. That doesn’t mean though that if you’re a small company with a small following that you won’t rank in the Top 50 report – it’s mostly down to engagement. This is where the type of content you post on social can really have an impact and highlights the link between all three channels (website, blog and social). You might share a blog post on multiple social channels which leads people to your website, so all aspects are very important.
The table below shows the average number of tweets per day, retweets and likes across Twitter accounts for the Top 50 and the average. The Top 50 post on average 2.89 times per day, receive 1.79 retweets per post and receive 3.54 likes per post.

Table 2: Average number of tweets, retweets and likes on Twitter among the Top 50 and the average partner
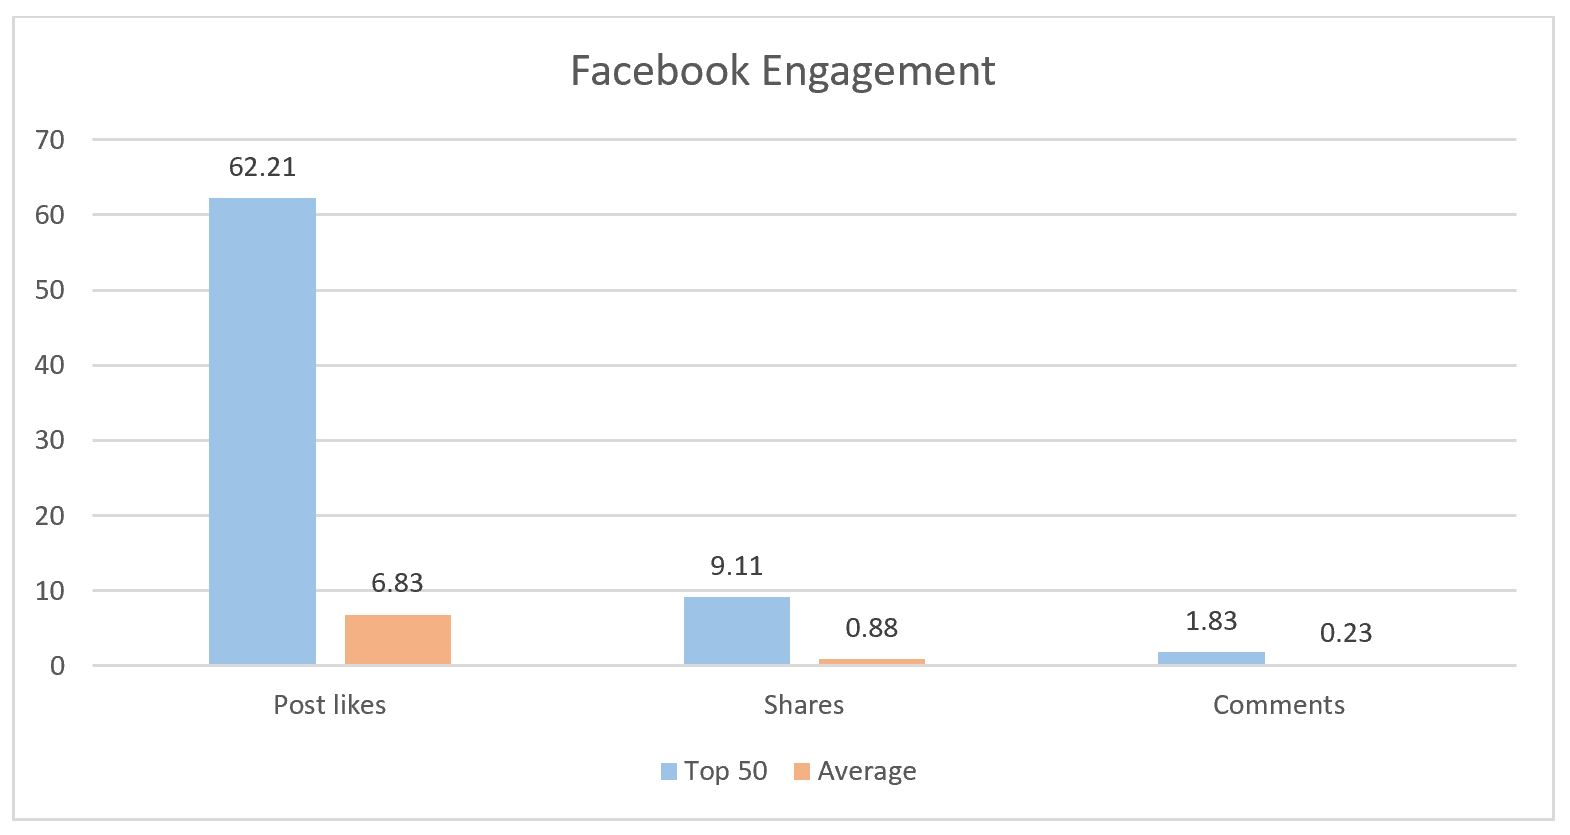
With regards to Facebook, the graph below demonstrates the distinction between the Top 50 and the average. The Top 50 had 9X more post likes, 10X more shares and 8X more comments.

Figure 3: Engagement on Facebook for the Top 50 and the average partner
Are you in the Microsoft Partner Top 50?
To find out where you ranked this year, sign up and receive a copy of the report directly to your inbox. Or, if you’re attending the conference in July, be sure to come to our stall to pick up yours in person, or just stop by for a chat.
More updates on our report and preparation for Microsoft Inspire will be released in the run up to the conference. While you wait, why not see what’s happening on our website? We have tips and tricks for the conference, and you can read past interviews with industry experts with plenty of advice to help you make the most of your trip.
Looking forward to seeing you in July. Visit us at booth #616!
